The Sydney housing supply forecast provides the latest estimates on where, when and how many new homes are likely to be built in greater Sydney in the years ahead.
The housing supply forecast is updated each year to inform governments, industry and the public about potential future housing supply. The forecast is a key input to strategic planning decisions, including planning for land use, infrastructure, open spaces and community services.
The forecast is for dwelling completions including:
- detached housing
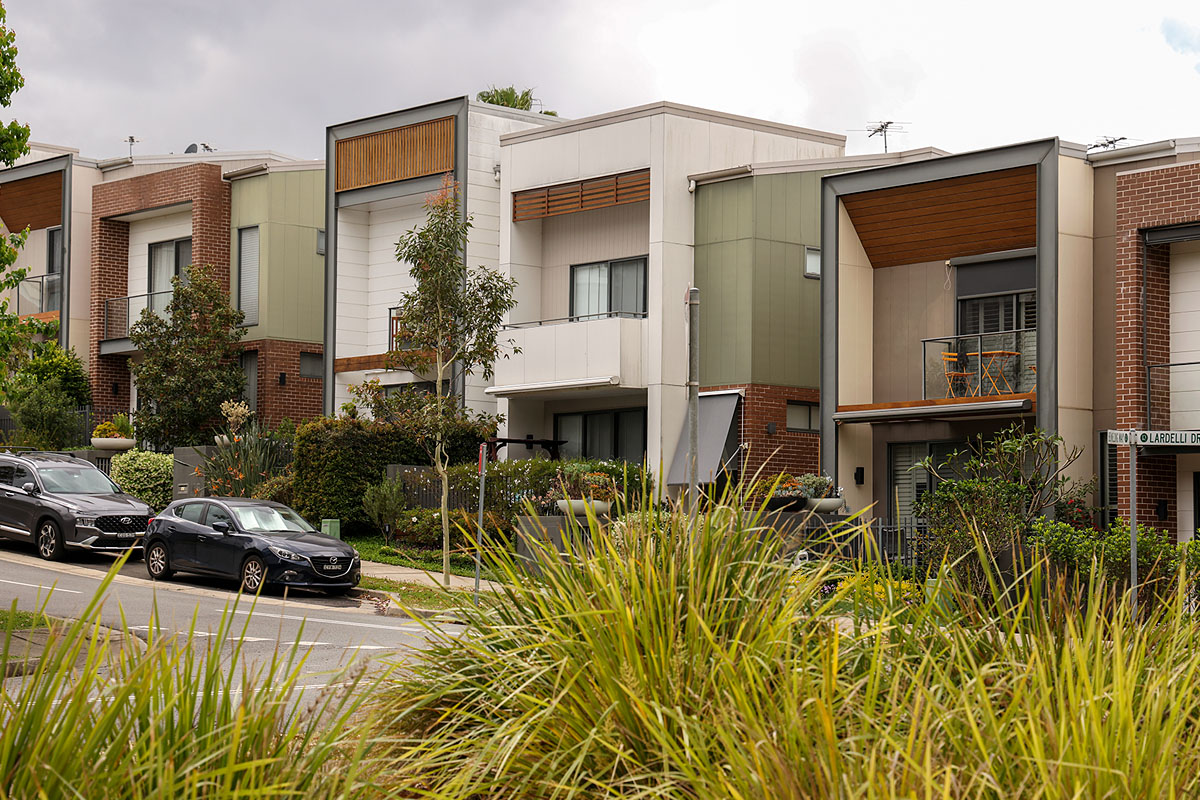
- medium-density housing – terraces, townhouses and villas
- apartments.
The forecast is a key input in the development of housing targets.
How many new homes will be built
Greater Sydney housing supply is forecast to increase by 172,900 homes over the 6 years to 2028–29, averaging 28,800 additional dwellings per year.
The forecast is a point in time estimate, as at December 2023 and is updated each year to reflect new planning reforms over the previous 12 months. The forecast provides a baseline estimate of new housing growth.
The introduction of recently announced reforms to increase diverse and well-located homes are expected to impact planning capacity in 2024 and contribute to new housing supply above the baseline.
These trends may change due to the impact of policy, economic, social and other factors on housing development.
More information about the method and assumptions used for the Sydney housing supply forecast.
Learn more about the housing supply annual forecast for Greater Sydney.
Latest forecast
The Sydney housing supply forecast can be viewed on the Greater Sydney Urban Development Program dashboard.
The data is available to download at the following levels:
- Local government area (LGA)
- ASGS 2021 Statistical Areas Level 2 (SA2)
- Suburb
- Greenfield precinct.