Camden Council’s housing target
How we developed the housing targets
Planned growth: The housing target for each council is based on the number of homes already in the pipeline for delivery which have existing approvals or where rezonings have already occurred.
Projected growth: The targets then factor in the expected delivery of homes which can occur in the next 5 years based on the NSW Government’s planning reforms. Existing infrastructure, ongoing investments, and local constraints have all been considered in the development of the targets.
The following data is the latest available from the Australian Bureau of Statistics:
Providing essential infrastructure to align with more homes
These targets consider existing infrastructure and housing activity already underway.
The NSW Government is committed to providing infrastructure like hospitals, schools, roads, active transport and open spaces to support the delivery of more well-located, well-designed, and well-built homes.
For more information on schools infrastructure upgrades.
For more information on parks and open spaces.
For more information on health infrastructure upgrades.
For more information about Transport for NSW upgrades.
Planning for more resilient and liveable communities
Understanding the status of heat vulnerability and tree canopy coverage is important to help identify community needs and ensure new housing development is sustainable, liveable and resilient to climate change. The statistics below are based on the Department’s most recent heat vulnerability and tree canopy mapping.
Heat vulnerability
Heat vulnerability is determined by a number of factors including demographics, tree canopy cover and land surface temperatures.
The level of heat vulnerability is expressed as a Heat Vulnerability Index (HVI) category from one to five.
In Camden, approximately 14% of neighbourhoods in Camden have high heat vulnerability (HVI category 5), 72% have moderate heat vulnerability (HVI 3 or 4), and 14% have low heat vulnerability (HVI 1 or 2).
1 = low vulnerability, 5 = high vulnerability
Camden’s urban tree canopy
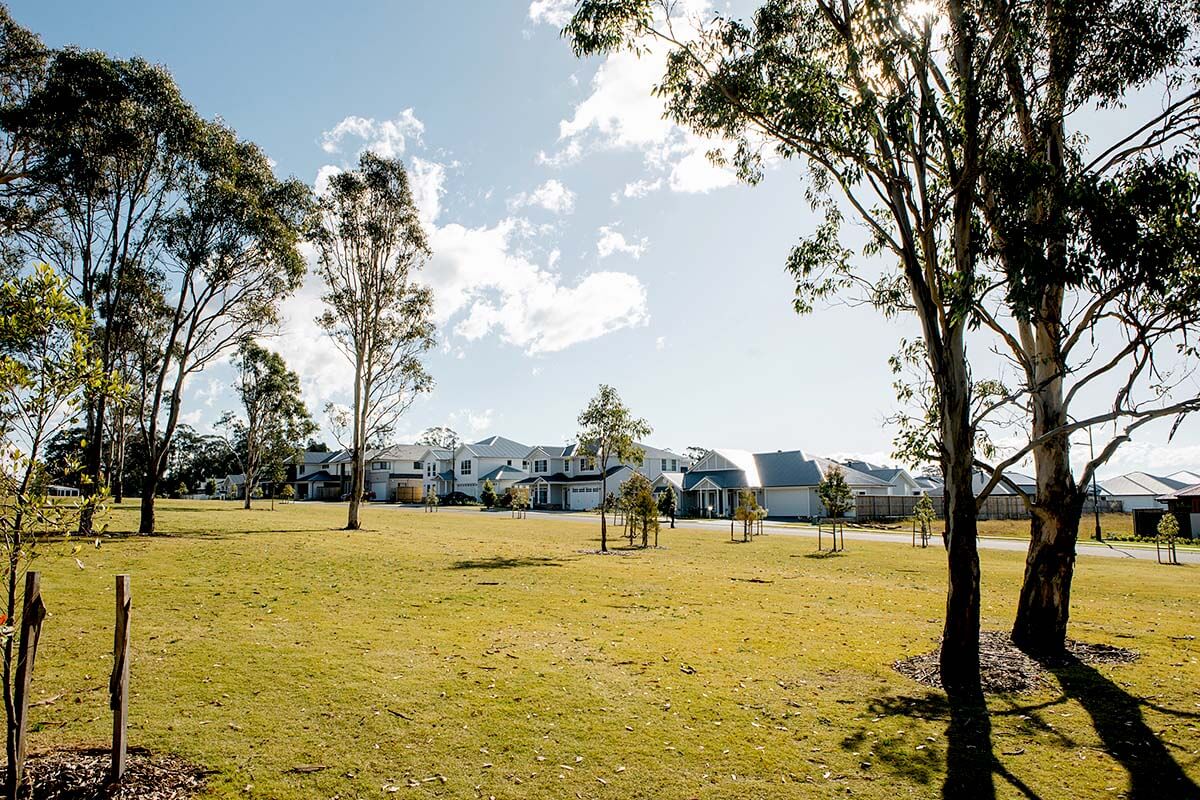
Camden’s urban area has a total tree canopy cover of 13.6%.
People who live in urban areas with at least 30% green cover can experience improved mental and physical health outcomes. In Camden, 19% of communities have access to tree canopy cover of 30% or more.
Like Greater Sydney, properties, including residential, commercial and industrial land, make up most of Camden’s urban area and provide most of its tree canopy (70%). However, both properties and streets have low tree canopy cover relative to their land area, providing opportunities to increase greening. The urban canopy cover on streets, parks and properties is:
Street Tree Canopy
13% of urban Camden is made up of streets. Streets have 8% canopy cover.
Park Tree Canopy
12% of urban Camden is made up of parks. Parks have 26% canopy cover.
Property Tree Canopy
76% of urban Camden is made up of properties. Properties have 13% canopy cover.
More information on heat vulnerability and canopy cover in Greater Sydney is available at Urban heat and canopy data or visit the NSW SEED Portal for the 2022 heat vulnerability index and 2022 canopy access data.


